Let’s think about a user clicks your link on Google, but the page takes forever to load.
They tap impatiently, watch the layout shift twice, and before anything stabilizes, they’re gone. That’s the harsh reality of poor performance. Your content might be brilliant, but if your site isn’t fast, smooth, and responsive, people won’t stick around long enough to see it.
That’s exactly why Core Web Vitals exist and to secure website you need technical seo guidelines for developing website performance. They measure how real people experience your website, not just what your code says. And mastering them can make the difference between a frustrated visitor and a loyal customer.
You can check the google core web vitals with site audit tool, that will help you to know in depth of the website performance.

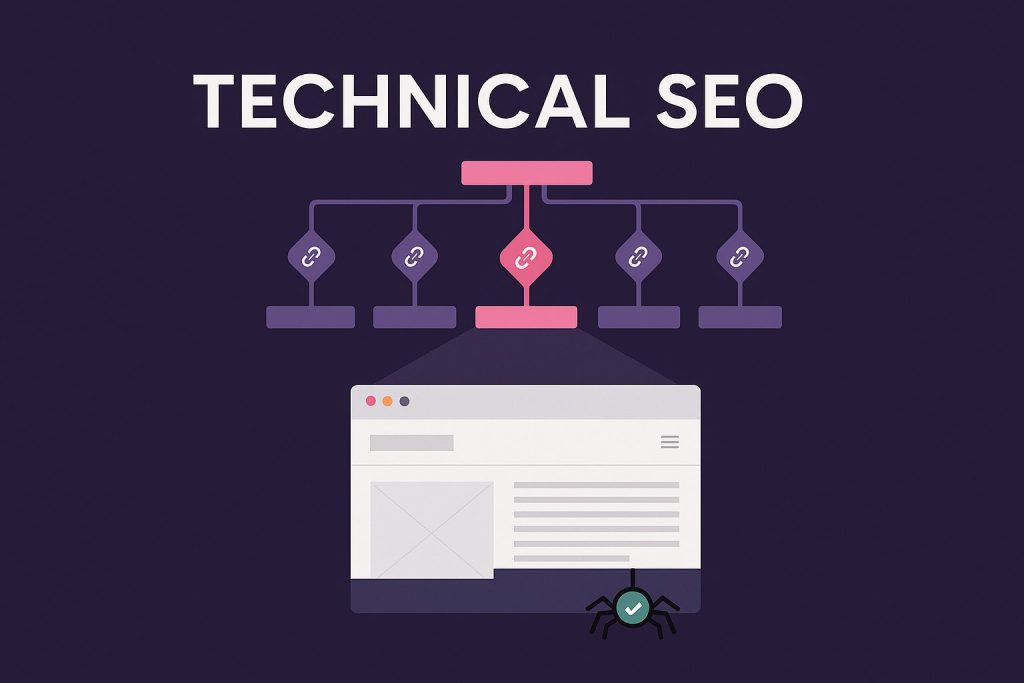
What Are the Core Web Vitals?
Core Web Vitals are a set of metrics introduced by Google to measure real-world user experience.
Instead of focusing on technical numbers, these vitals track what truly matters and know how fast a page loads, how responsive it feels, and how stable it looks while loading.
Think of them as a health report for your website’s performance.
If your site feels smooth and effortless, you pass. If it lags or jumps, you fail.
There are three key Core Web Vitals to pay attention to:
- Largest Contentful Paint (LCP) – How quickly the main content (like the hero image or headline) appears.
- Interaction to Next Paint (INP) – How fast the site responds after a user’s click or tap.
- Cumulative Layout Shift (CLS) – How visually stable your page is as it loads.
Each of these plays a unique role in shaping how a user feels while browsing your site. When all three perform well, your website feels fast, clean, and professional.
Why Core Web Vitals Are So Important
Imagine you’re walking into a store where the door takes five seconds to open, the lights flicker, and the shelves move around while you’re trying to pick something. You’d leave, right?
That’s what happens when a website ignores Core Web Vitals.
Better Rankings and Visibility
Google rewards sites that load quickly and deliver a good experience. A strong CWV score helps your pages rank higher and attract more clicks, but not just because of SEO, but because people stay longer and engage more.

Site Health Image of my website with Super Charge
Happier Visitors and Higher Conversions
A faster website feels more trustworthy. Users are more likely to read, subscribe, or buy when everything loads smoothly.
Studies show that improving load time by even one second can increase conversions by up to 10%.
Improved Brand Credibility
When your site performs well, it leaves a lasting impression. Visitors remember how easy it was to browse — and that positive experience often leads to word-of-mouth recommendations.
Optimizing Core Web Vitals isn’t just for Google. Make a great list’s for your audience and their patience is limited.
Understanding the Core Web Vitals Metrics
Let’s explore each metric and what it reveals about your website’s performance.
1. Largest Contentful Paint (LCP)
LCP measures how long it takes for the main content to become visible.
If your site’s hero image, banner, or text takes too long to appear, users perceive your site as slow — even if the rest of the content loads later.
Ideal LCP score: 2.5 seconds or less.
Main culprits: slow servers, large images, render-blocking scripts, and unoptimized fonts.
A quick tip — focus on how soon visitors see something meaningful. The faster the visual reassurance, the better the first impression.
2. Interaction to Next Paint (INP)
INP replaced the old metric FID. It measures how quickly your website responds when someone interacts and clicking buttons, typing in forms, or expanding menus.
Ideal INP score: 200 milliseconds or less.
If your site hesitates or freezes before responding, users lose trust.
What causes delays? Too much JavaScript, large page components, or overloaded main threads.
A responsive site feels alive every click should instantly confirm “Yes, it worked.”

3. Cumulative Layout Shift (CLS)
Ever tried reading an article when suddenly the text jumps because an ad or image loads late? That’s a layout shift and it’s one of the most annoying user experiences.
Ideal CLS score: 0.1 or lower.
Main causes: images or videos without defined dimensions, injected banners, or fonts loading unpredictably.
A visually stable layout builds confidence. Your site shouldn’t surprise people — it should behave exactly as they expect.
How to Check Your Core Web Vitals Performance?
Before you begin optimizing anything, it’s crucial to understand where your website currently stands.
Just like a doctor examines vital signs before prescribing treatment, you need the right tools to measure your site’s health. Core Web Vitals are performance metrics based on real user experience, and the good news is that Google gives us powerful, free tools to analyze them accurately.
Let’s explore the three most useful tools Google PageSpeed Insights, Google Search Console, and Lighthouse in Chrome DevTools and how each provides a different layer of insight into your website’s performance.
1. Google PageSpeed Insights
Think of Google PageSpeed Insights (PSI) as your website’s performance report card.
It doesn’t just tell you whether your site is fast or slow — it explains why. When you enter your URL on PageSpeed Insights, Google’s engine runs a complete test using both lab data (simulated environment) and field data (real-world performance collected from Chrome users).
The lab data helps developers pinpoint issues in a controlled test — like a performance stress test in ideal conditions. Meanwhile, field data shows how your actual visitors experience the site across different devices and networks.
Each metric — Largest Contentful Paint (LCP), Interaction to Next Paint (INP), and Cumulative Layout Shift (CLS) — is displayed with color-coded scores:
- Green (Good)
- Orange (Needs Improvement)
- Red (Poor)
Here is the Core Web Vitals of my avenuesangma.com website. (Diagnose performance issues)

Below these metrics, you’ll find a “Diagnostics” section listing specific problems, such as render-blocking resources, unused CSS, or oversized images.
What makes PageSpeed Insights invaluable is its actionable advice. It not only highlights what’s wrong but also provides clear “Opportunities” for instance, “Reduce unused JavaScript” or “Serve images in next-gen formats.”
By fixing those recommendations, you directly improve your Core Web Vitals — often within a single development cycle.
2. Google Search Console
While PageSpeed Insights shows a page-by-page snapshot, Google Search Console (GSC) gives you a bird’s-eye view of your entire website’s performance in search results.

Once your site is verified, head to “Experience → Core Web Vitals” in the left menu. You’ll see two tabs — one for Mobile and one for Desktop — because user experiences differ across devices.
Each tab categorizes your URLs into three groups:
- Good URLs (meeting all CWV thresholds)
- URLs that need improvement
- Poor URLs (failing at least one metric)

What makes Search Console special is its real-user data integration. The report is built from the Chrome User Experience (CrUX) dataset, meaning it reflects genuine performance from visitors worldwide — not a lab simulation.
If multiple pages share similar templates or loading patterns, GSC groups them together, helping you fix entire batches of pages at once. For example, if all product pages share a slow-loading image carousel, one fix can improve hundreds of URLs.
GSC also shows trend graphs, so you can see whether your recent updates are improving or hurting performance. Tracking progress over time keeps your optimization efforts measurable and consistent.
Use GSC as your long-term monitoring dashboard, it’s where technical performance meets SEO insight.
3. Lighthouse in Chrome DevTools
While PageSpeed Insights and Search Console provide reports from Google’s servers, Lighthouse in Chrome DevTools lets you analyze performance directly inside your browser.
Think of it as a personal lab for testing fast, precise, and completely under your control.
To use it, open your website in Google Chrome, right-click anywhere, and select “Inspect” (or pressCtrl + Shift + Ion Windows /Cmd + Option + Ion Mac).
Then navigate to the “Lighthouse” panel, choose the categories you want to test (Performance, Accessibility, SEO, Best Practices, and PWA), and click “Analyze page load.”
Within seconds, Lighthouse generates a comprehensive audit. You’ll see metrics for LCP, INP, CLS, and more, along with a score from 0 to 100.
But the real power lies in its Performance Breakdown. It shows:
- How long each resource takes to load.
- Which scripts block rendering.
- How much time is spent on the main thread.
- Opportunities to defer or lazy-load specific elements.

Lighthouse also highlights “Long Tasks” — the milliseconds where your browser was too busy to respond to user input.
This insight is gold for developers because it points directly to the JavaScript functions or network requests causing slowdowns.
Unlike Search Console (which updates data periodically), Lighthouse can be used instantly after each code change, making it perfect for continuous optimization and debugging during development.
4. Other Complementary Tools
In addition to Google’s ecosystem, there are several third-party tools worth using for deeper analysis:
- GTmetrix: Offers a detailed waterfall chart showing how each element loads, helping identify bottlenecks like unoptimized images or excessive requests.
- WebPageTest.org: Allows you to simulate different devices, browsers, and connection speeds, providing a more global view of performance.
- Chrome User Experience Report (CrUX): Aggregates anonymous, real-world user data from Chrome to show how your site performs under actual conditions worldwide.
Using these tools together gives you a complete picture from individual resource timing (Lighthouse) to aggregate user trends (CrUX and GSC).
Bringing It All Together
When checking Core Web Vitals, remember: each tool has a unique purpose.
- PageSpeed Insights tells you what is wrong and how to fix it.
- Search Console tells you which pages are affected and how they trend over time.
- Lighthouse tells you why those problems exist in technical detail.
By combining all three, you move from observation to insight — and from insight to action.
Once you’ve gathered the data, prioritize fixes for pages that drive the most traffic, leads, or sales. Improving even a handful of key pages can dramatically enhance your site’s overall Core Web Vitals and to learn more about this SEO guide can help you to make sure your website performance.